Visualizing Apache Logs Using the Elastic Stack on Debian 8
Traducciones al EspañolEstamos traduciendo nuestros guías y tutoriales al Español. Es posible que usted esté viendo una traducción generada automáticamente. Estamos trabajando con traductores profesionales para verificar las traducciones de nuestro sitio web. Este proyecto es un trabajo en curso.


What is an Elastic Stack?
The Elastic stack, which includes Elasticsearch, Logstash, and Kibana, is a troika of tools that provides a free and open-source solution that searches, collects and analyzes data from any source and in any format and visualizes it in real time.
This guide will explain how to install all three components and use them to explore Apache web server logs in Kibana, the browser-based component that visualizes data.
This guide will walk through the installation and set up of version 5 of the Elastic stack, which is the latest at time of this writing.
NoteThis guide is written for a non-root user. Commands that require elevated privileges are prefixed withsudo. If you’re not familiar with thesudocommand, you can check our Users and Groups guide.
Before You Begin
Familiarize yourself with our Getting Started guide and complete the steps for setting your Linode’s hostname and timezone.
Follow the steps in our Apache Web Server on Debian 8 (Jessie) guide to set up and configure Apache on your server.
This guide will use
sudowherever possible. Complete the sections of our Securing Your Server to create a standard user account, harden SSH access and remove unnecessary network services.Update your system:
sudo apt-get update && sudo apt-get upgrade
Install OpenJDK 8
Elasticsearch requires the most recent versions of Java, and will not run with the default OpenJDK version available on Debian Jessie. Install the jessie-backports source in order to get OpenJDK 8:
Add Jessie backports to your list of APT sources:
echo deb http://ftp.debian.org/debian jessie-backports main | sudo tee -a /etc/apt/sources.list.d/jessie-backports.listUpdate the APT package cache:
sudo apt-get updateInstall OpenJDK 8:
sudo apt-get install -y -t jessie-backports openjdk-8-jre-headless ca-certificates-javaMake sure your system is using the updated version of Java. Run the following command and choose
java-8-openjdk-amd64/jre/bin/javafrom the dialogue menu that opens:sudo update-alternatives --config java
Install Elastic APT Repository
The Elastic package repositories contain all of the necessary packages for this tutorial, so install it first before proceeding with the individual services.
Install the official Elastic APT package signing key:
wget -qO - https://artifacts.elastic.co/GPG-KEY-elasticsearch | sudo apt-key add -Install the
apt-transport-httpspackage, which is required to retrieve deb packages served over HTTPS on Debian 8:sudo apt-get install apt-transport-httpsAdd the APT repository information to your server’s list of sources:
echo "deb https://artifacts.elastic.co/packages/5.x/apt stable main" | sudo tee -a /etc/apt/sources.list.d/elastic-5.x.listRefresh the list of available packages:
sudo apt-get update
Install Elastic Stack
Before configuring and loading log data, install each piece of the stack, individually.
Elasticsearch
Install the
elasticsearchpackage:sudo apt-get install elasticsearchSet the JVM heap size to approximately half of your server’s available memory. For example, if your server has 1GB of RAM, change the
XmsandXmxvalues in the/etc/elasticsearch/jvm.optionsfile to the following, and leave the other values in this file unchanged:- File: /etc/elasticsearch/jvm.options
1 2-Xms512m -Xmx512m
Start and enable the
elasticsearchservice:sudo systemctl enable elasticsearch sudo systemctl start elasticsearchWait a few moments for the service to start, then confirm that the Elasticsearch API is available:
curl localhost:9200Elasticsearch may take some time to start up. If you need to determine whether the service has started successfully or not, you can use the
systemctl status elasticsearchcommand to see the most recent logs. The Elasticsearch REST API should return a JSON response similar to the following:{ "name" : "e5iAE99", "cluster_name" : "elasticsearch", "cluster_uuid" : "lzuLNZa0Qo-7_puJZZjR4Q", "version" : { "number" : "5.5.2", "build_hash" : "b2f0c09", "build_date" : "2017-08-14T12:33:14.154Z", "build_snapshot" : false, "lucene_version" : "6.6.0" }, "tagline" : "You Know, for Search" }
Logstash
Install the logstash package:
sudo apt-get install logstash
Kibana
Install the kibana package:
sudo apt-get install kibana
Configure Elastic Stack
Elasticsearch
By default, Elasticsearch will create five shards and one replica for every index that’s created. When deploying to production, these are reasonable settings to use. In this tutorial, only one server is used in the Elasticsearch setup, so multiple shards and replicas are unnecessary. Changing these defaults can avoid unnecessary overhead.
Create a temporary JSON file with an index template that instructs Elasticsearch to set the number of shards to one and number of replicas to zero for all matching index names (in this case, a wildcard
*):- File: template.json
1 2 3 4 5 6 7 8 9{ "template": "*", "settings": { "index": { "number_of_shards": 1, "number_of_replicas": 0 } } }
Use
curlto create an index template with these settings that’ll be applied to all indices created hereafter:curl -XPUT http://localhost:9200/_template/defaults -d @template.jsonElasticsearch should return:
{"acknowledged":true}
Logstash
In order to collect Apache access logs, Logstash must be configured to watch any necessary files and then process them, eventually sending them to Elasticsearch. This configuration file assumes that a site has been set up according to the previously mentioned Apache Web Server on Debian 8 (Jessie) guide to find the correct log path.
Create the following Logstash configuration:
- File: /etc/logstash/conf.d/apache.conf
1 2 3 4 5 6 7 8 9 10 11 12 13 14 15input { file { path => '/var/www/*/logs/access.log' } } filter { grok { match => { "message" => "%{COMBINEDAPACHELOG}" } } } output { elasticsearch { } }
Start and enable
logstash:sudo systemctl enable logstash sudo systemctl start logstash
Kibana
Open
/etc/kibana/kibana.yml. Uncomment the following two lines and replacelocalhostwith the public IP address of your Linode. If you have a firewall enabled on your server, make sure that the server accepts connections on port5601.- File: /etc/kibana/kibana.yml
1 2server.port: 5601 server.host: "localhost"
Enable and start the Kibana service:
sudo systemctl enable kibana sudo systemctl start kibanaIn order for Kibana to find log entries to configure an index pattern, logs must first be sent to Elasticsearch. With the three daemons started, log files should be collected with Logstash and stored in Elasticsearch. To generate logs, issue several requests to Apache:
for i in `seq 1 5` ; do curl localhost ; sleep 0.2 ; doneNext, open Kibana in your browser. Kibana listens for requests on port
5601, so depending on your Linode’s configuration, you may need to port-forward Kibana through SSH. The landing page should look similar to the following: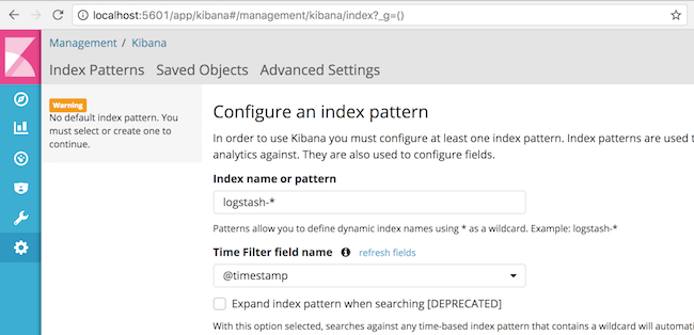
This screen permits you to create an index pattern, which is a way for Kibana to know which indices to search for when browsing logs and creating dashboards. The default value of
logstash-*matches the default indices created by Logstash. Clicking “Create” on this screen is enough to configure Kibana and begin reading logs.Note
Throughout this section, logs will be retrieved based upon a time window in the upper right corner of the Kibana interface (such as “Last 15 Minutes”). If at any point, log entries no longer are shown in the Kibana interface, click this timespan and choose a wider range, such as “Last Hour” or “Last 1 Hour” or “Last 4 Hours,” to see as many logs as possible.
View Logs
After the previously executed curl commands created entries in the Apache access logs, Logstash will have indexed them in Elasticsearch. These are now visible in Kibana.
The “Discover” tab on the left-hand side of Kibana’s interface (which should be open by default after configuring your index pattern) should show a timeline of log events:
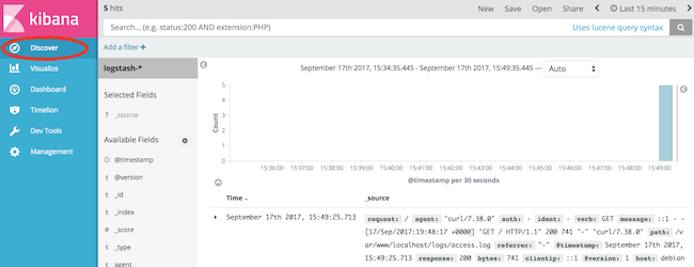
Over time, and as other requests are made to the web server via curl or a browser, additional logs can be seen and searched from Kibana. The Discover tab is a good way to familiarize yourself with the structure of the indexed logs and determine what to search and analyze.
In order to view the details of a log entry, click the drop-down arrow to see individual document fields:
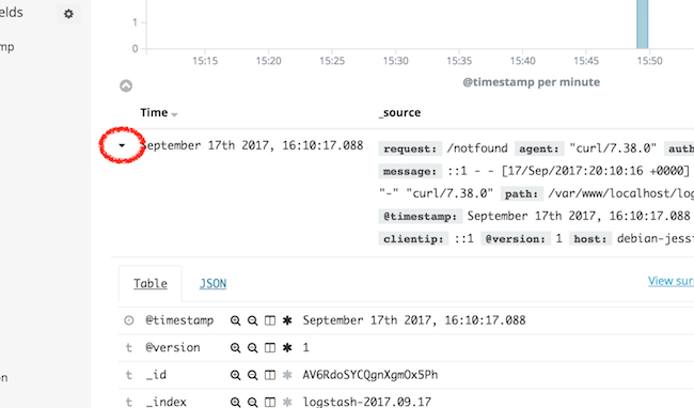
Fields represent the values parsed from the Apache logs, such as agent, which represents the User-Agent header, and bytes, which indicates the size of the web server response.
Analyze Logs
Before continuing, generate a couple of dummy 404 log events in your web server logs to demonstrate how to search and analyze logs within Kibana:
for i in `seq 1 2` ; do curl localhost/notfound-$i ; sleep 0.2 ; done
Search Data
The top search bar within the Kibana interface allows you to search for queries following the query string syntax to find results.
For example, to find the 404 error requests you generated from among 200 OK requests, enter the following in the search box:
response:404
Then, click the magnifying glass search button.

The user interface will now only return logs that contain the “404” code in their response field.
Analyze Data
Kibana supports many types of Elasticsearch queries to gain insight into indexed data. For example, consider the traffic that resulted in a “404 - not found” response code. Using aggregations, useful summaries of data can be extracted and displayed natively in Kibana.
To create one of these visualizations, begin by selecting the “Visualize” tab:
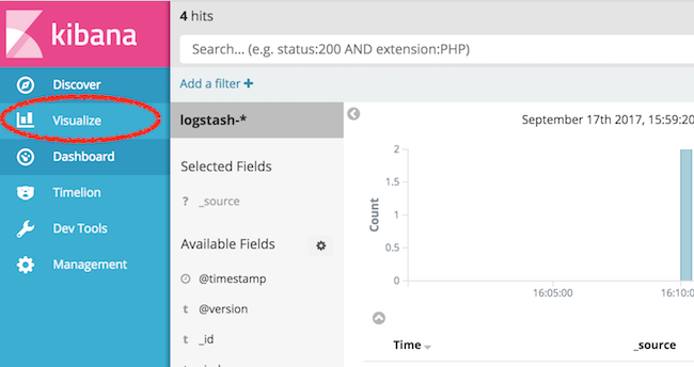
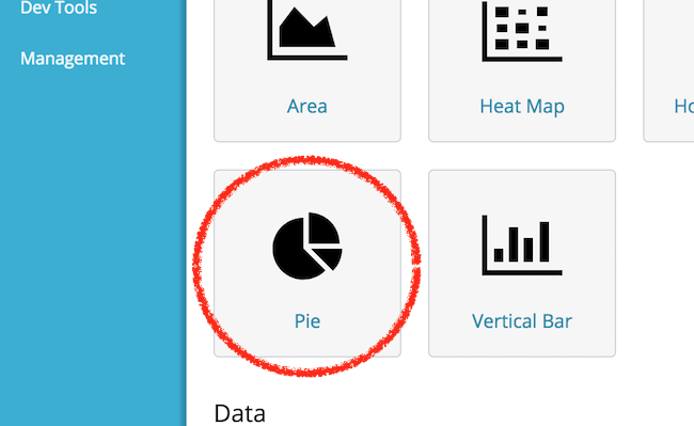
Then, select one of the icons to create a visualization:

Select “Pie” to create a new pie chart:
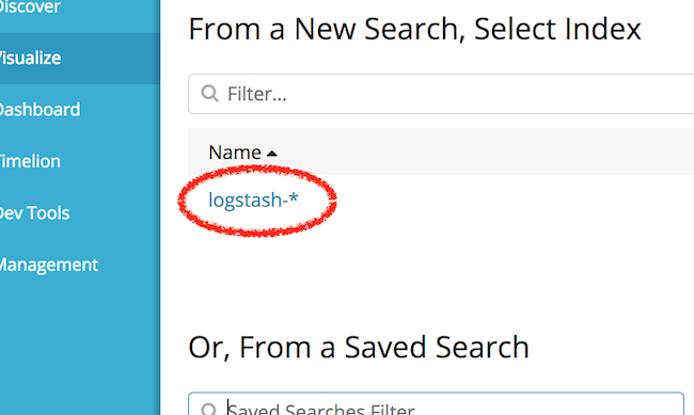
Then select the logstash-* index pattern to determine from where the data for the pie chart will come:
At this point, a pie chart should appear in the interface ready to be configured. Follow these steps to configure the visualization in the user interface pane that appears to the left of the pie chart:
- Select “Split Slices” to create more than one slice in the visualization.
- From the “Aggregation” drop-down menu, select “Terms” to indicate that unique terms of a field will be the basis for each slice of the pie chart.
- From the “Field” drop-down menu, select
response.keyword. This indicates that theresponsefield will determine the size of the pie chart slices. - Finally, click the “Play” button to update the pie chart and complete the visualization.
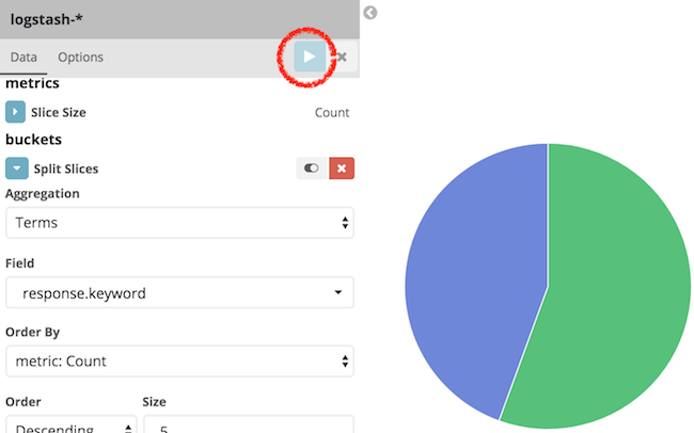
Observe that only a portion of requests have returned a 404 response code (remember to change the aforementioned time span if your curl requests occurred earlier than you are currently viewing). This approach of collecting summarized statistics about the values of fields within your logs can be similarly applied to other fields, such as the http verb (GET, POST, etc.), or can even create summaries of numerical data, such as the total amount of bytes transferred over a given time period.
If you wish to save this visualization for use later use, click the “Save” button near the top of the browser window to name the visualization and save it permanently to Elasticsearch.
Further Reading
Although this tutorial has provided an overview of each piece of the Elastic stack, more reading is available to learn additional ways to process and view data, such as additional Logstash filters to enrich log data, or other Kibana visualizations to present data in new and useful ways.
Comprehensive documentation for each piece of the stack is available from the Elastic web site:
- The Elasticsearch reference contains additional information regarding how to operate Elasticsearch, including clustering, managing indices, and more.
- The Logstash documentation contains useful information on additional plug-ins that can further process raw data, such as geolocating IP addresses, parsing user-agent strings, and other plug-ins.
- Kibana’s documentation pages provide additional information regarding how to create useful visualizations and dashboards.
More Information
You may wish to consult the following resources for additional information on this topic. While these are provided in the hope that they will be useful, please note that we cannot vouch for the accuracy or timeliness of externally hosted materials.
This page was originally published on


